Inhaltsverzeichnis
Mixed indicators
→ Graphical representation of the mixed key figures
REX/PSI provides both analytical mixing indicators and regression models based on numerical simulations of the mixing effect of different zone types.
Analytical mixed indicators
In the short report and in the Mixture triangle three mixing ratios are displayed for the calculated screw.
Transverse mixing ratio
The transverse mixing ratio $\pi_{LSM}$ is calculated as follows: $$\pi_{LSM} = \left[ 1 + \left(c_0 \overline{\gamma} \right)^2 \right]^{-1/2}$$ $$\text{with}$$ $$\overline{\gamma} = \frac{2 \left(1.03 + 0.074n \right) L}{\cos\varphi \sin\varphi} \cdot \frac{1}{h_1 \, \pi_\dot{m}}$$ $$\text{and}$$ $$c_0 = c_1 \sqrt{\frac{h_1}{h_0}} \left(\frac{T_z}{T_0}\right)^{c_2} \frac{n^{c_3}}{\pi_\dot{m}}$$
with c1=0.08367, c2=0.7067 and c3=0.344
Longitudinal mixing ratio
The longitudinal mixing ratio $\sigma^2$ is calculated as follows
$$\sigma^2 = 1 + \exp(c_1 \Theta_{min}^{c_2}) - \exp(c_3 \Theta_{min})$$
with the dimensionless minimum residence time $\Theta_{min} = \frac{t_{min}}{\bar{t}}$ and
| extruder type | c1 | c2 | c3 |
|---|---|---|---|
| melt extruder | 0.2476 | 0.6014 | 0.8301 |
| Conv. plasticising extruder | -4.8828 | 2.1287 | 0.0028505 |
| grooved barrel extruder | -2.368 | 1.1268 | 0.1186 |
Agglomerate size reduction
The agglomerate size reduction ratio $Z$ is calculated as follows:
$$Z=\left[ 1+\left( \frac{t}{c_{31}}\right)^{c_{21}}\left( ln\left( \frac{\tau}{\tau_{min}}\right)\right)^{1/c_{11}}\right]^{-1}$$
with the current shear stress $\tau$, the minimum shear stress $\tau_{min}$ and the three decay constants $c$. The minimum shear stress and the three decay constants are Material parameters. REX offers default values at the push of a button.
Numerical mixing ratios
The numerical mixing quality is calculated from the following two parameters for determining the dispersive and distributive mixing quality, which are weighted from 100% - good to 0% - bad. weighted: The numerical mixing quality calculation is currently available for cross-hole mixing, diamond mixing, spiral shear elements and metering, spiral shear elements and metreing zones. The calculation is only for zones in which a completely melted melt is present, as the basis of the CFD simulations form the basis of the key figure. This will be continuously expanded in the future.
1. Dispersive mixing effect
The dispersive mixing quality is based on a regression equation for the so-called Mixing Index according to Manas, which was determined by means of numerical investigations using a CCD test plan. was determined. The mixing index according to Manas is a quantitative measure for describing the mixing mixing quality of numerical investigations, which allows conclusions to be drawn about the dispersive mixing behaviour. The index is determined from the deformation gradient and the vortex tensor:
\[ \lambda = \frac{|\Gamma|}{|\Gamma| + |\omega|} \] \[ \nabla \vec{v} = \begin{pmatrix} \frac{\partial v_x}{\partial x} & \frac{\partial v_x}{\partial y} & \frac{\partial v_x}{\partial z} \\ \frac{\partial v_y}{\partial x} & \frac{\partial v_y}{\partial y} & \frac{\partial v_y}{\partial z} \\ \frac{\partial v_z}{\partial x} & \frac{\partial v_z}{\partial y} & \frac{\partial v_z}{\partial z} \end{pmatrix} \]
\[ \Gamma = \frac{\left(\nabla \vec{v} + \nabla \vec{v}^T\right)}{2} \]
\[ \omega = \frac{\left(\nabla \vec{v} - \nabla \vec{v}^T\right)}{2} \]
\(\lambda\): Manas-number
\(\Gamma\): Deformation gradient tensor
\(\omega\): Vortex tensor
\(\nabla \vec{v}\): Velocity gradient
The mana number characterises the type of flow and is divided as follows
subdivided:
- λ = 1 pure elongation
- λ = 0.5 pure shear flow
- λ = 0 pure rotation
2. Distributive mixing effect
The distributive mixing quality is based on a regression equation determined using a CCD test plan for the evaluation method of a particle distribution based on the Delaunay triangulation, which was carried out as follows:
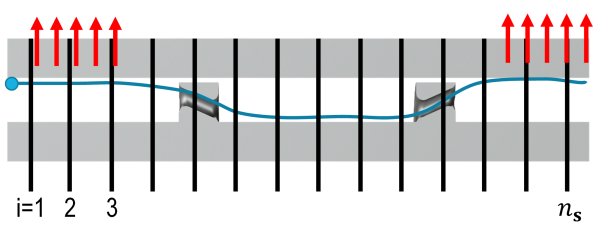
Based on the numerically calculated flow area, the particle trajectory of a particle distribution defined at the beginning of the flow area or at the beginning of the geometry can be calculated using the so-called particle tracking method. The particle distribution localised at the end of the flow region in the two-dimensional cross-section was then examined for homogeneity. For this purpose, a triangular mesh was created using Delaunay triangulation. At this point, the correlation that homogeneous area contents of the spanning triangles are accompanied by a homogeneously distributed particle distribution is used as a parameter for the evaluation or as a measure of the mixing quality. The so-called coefficient of variation, which relates the standard deviation of the triangular areas to the mean area, is used as the evaluation parameter. If all particles are evenly distributed, the coefficient of variation is zero (mixing quality 100 %); the coefficient of variation of the initial distribution (all particles in one half of the channel) is defined as 0 %.

3. Thermal mixing effect
An additional parameter is calculated for the cross-hole mixing section, which evaluates the effectiveness of the radial temperature equalisation. This is necessary because a targeted temperature exchange radial to the channel does not correlate with the results of the distributive mixing effect. For mixing parts that aim for general mixing (circumferential, radial and longitudinal direction), the thermal mixing effect correlates with the distributive mixing effect. For the cross-hole mixing part, which forces a pure exchange between fluid layers at the base of the screw and the barrel wall, a separate consideration is required. By definition, no direct statement about temperature distributions can be obtained from the isothermal CFD simulations. For this reason, the trajectory of each individual particle is analysed as part of particle tracking. The position in the channel is evaluated over the course of the mixing section and the Graetz number is analysed in order to map the influence of the operating point. A high mixing effect is achieved when all particles have spent sufficient time on the cylinder wall and screw base and effectively switch between the two areas.