Inhaltsverzeichnis
Thermodynamic data
Material data - Thermodynamics
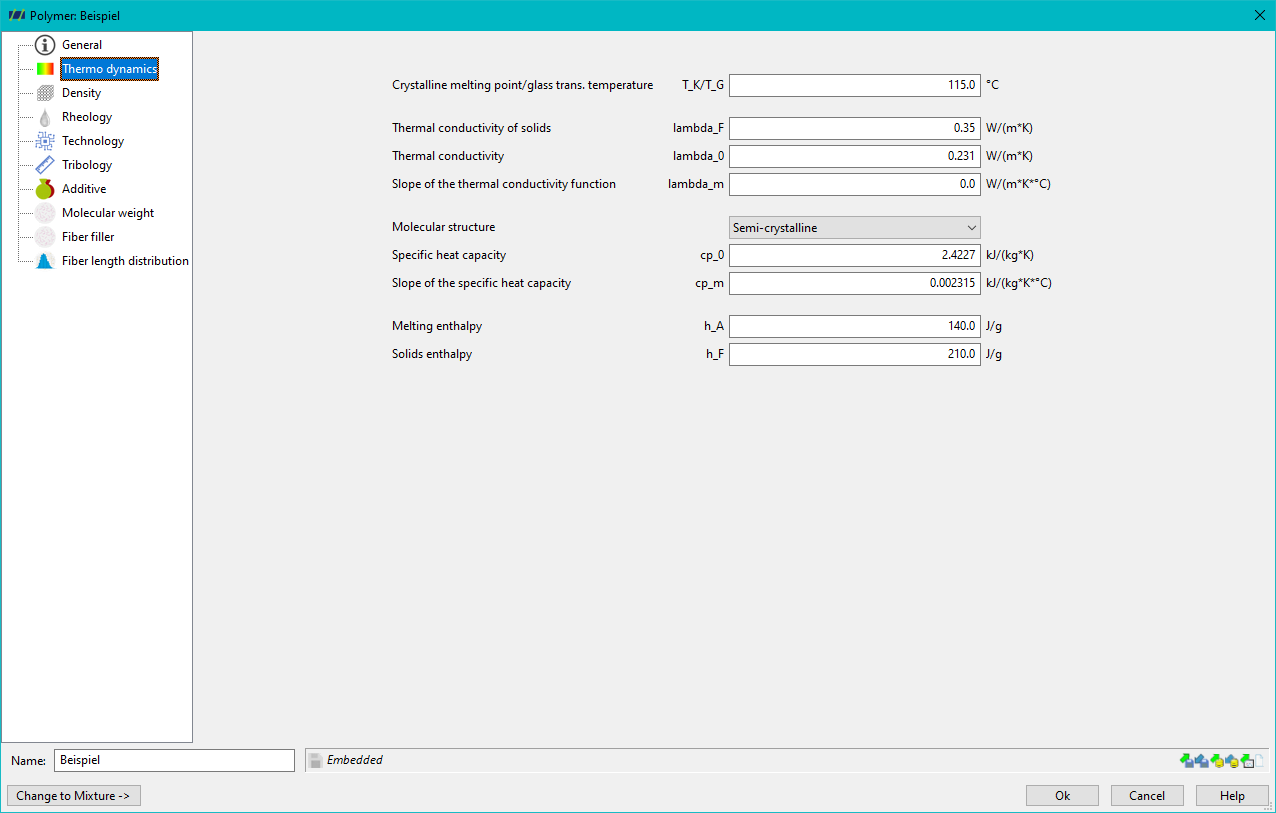
The rheological data of the material are entered in the ‘Thermodynamics’ tab:
- Crystalline melting/glass transition temperature: The crystallibe melting temperature (thermoplastic) corresponds to the temperature of the peak of the enthalpy curve. The glass transition temperature (amorphous plastic) corresponds to the temperature at which the amorphous plastic changes from a rigid, amorphous state to a soft state.
- Thermal conductivity: The thermal conductivity of the solid $\lambda_F$ is assumed to be constant. The thermal conductivity of the melt is specified for a value extrapolated to 0 °C ($\lambda_0$) with a gradient of $\lambda_m$ per 1 °C.
- Molecular structure: For semi-crystalline thermoplastics, a distinction is made between solids enthalpy and melting enthalpy. In the case of amorphous plastics, there is only an enthalpy of solids.
- Specific heat capacity: This is only required for the melt. It is modelled as a straight line with a constant gradient with a value extrapolated to 0 °C ($c_{p,0}$) and a gradient of $c_{p,m}$ per 1 °C.
- Melting enthalpy: The enthalpy for melting the crystalline areas (only partially crystalline plastics)
- Solids enthalpy: The enthalpy up to the crystalline melting/glass transition temperature, which is required for heating
Theoretical principles
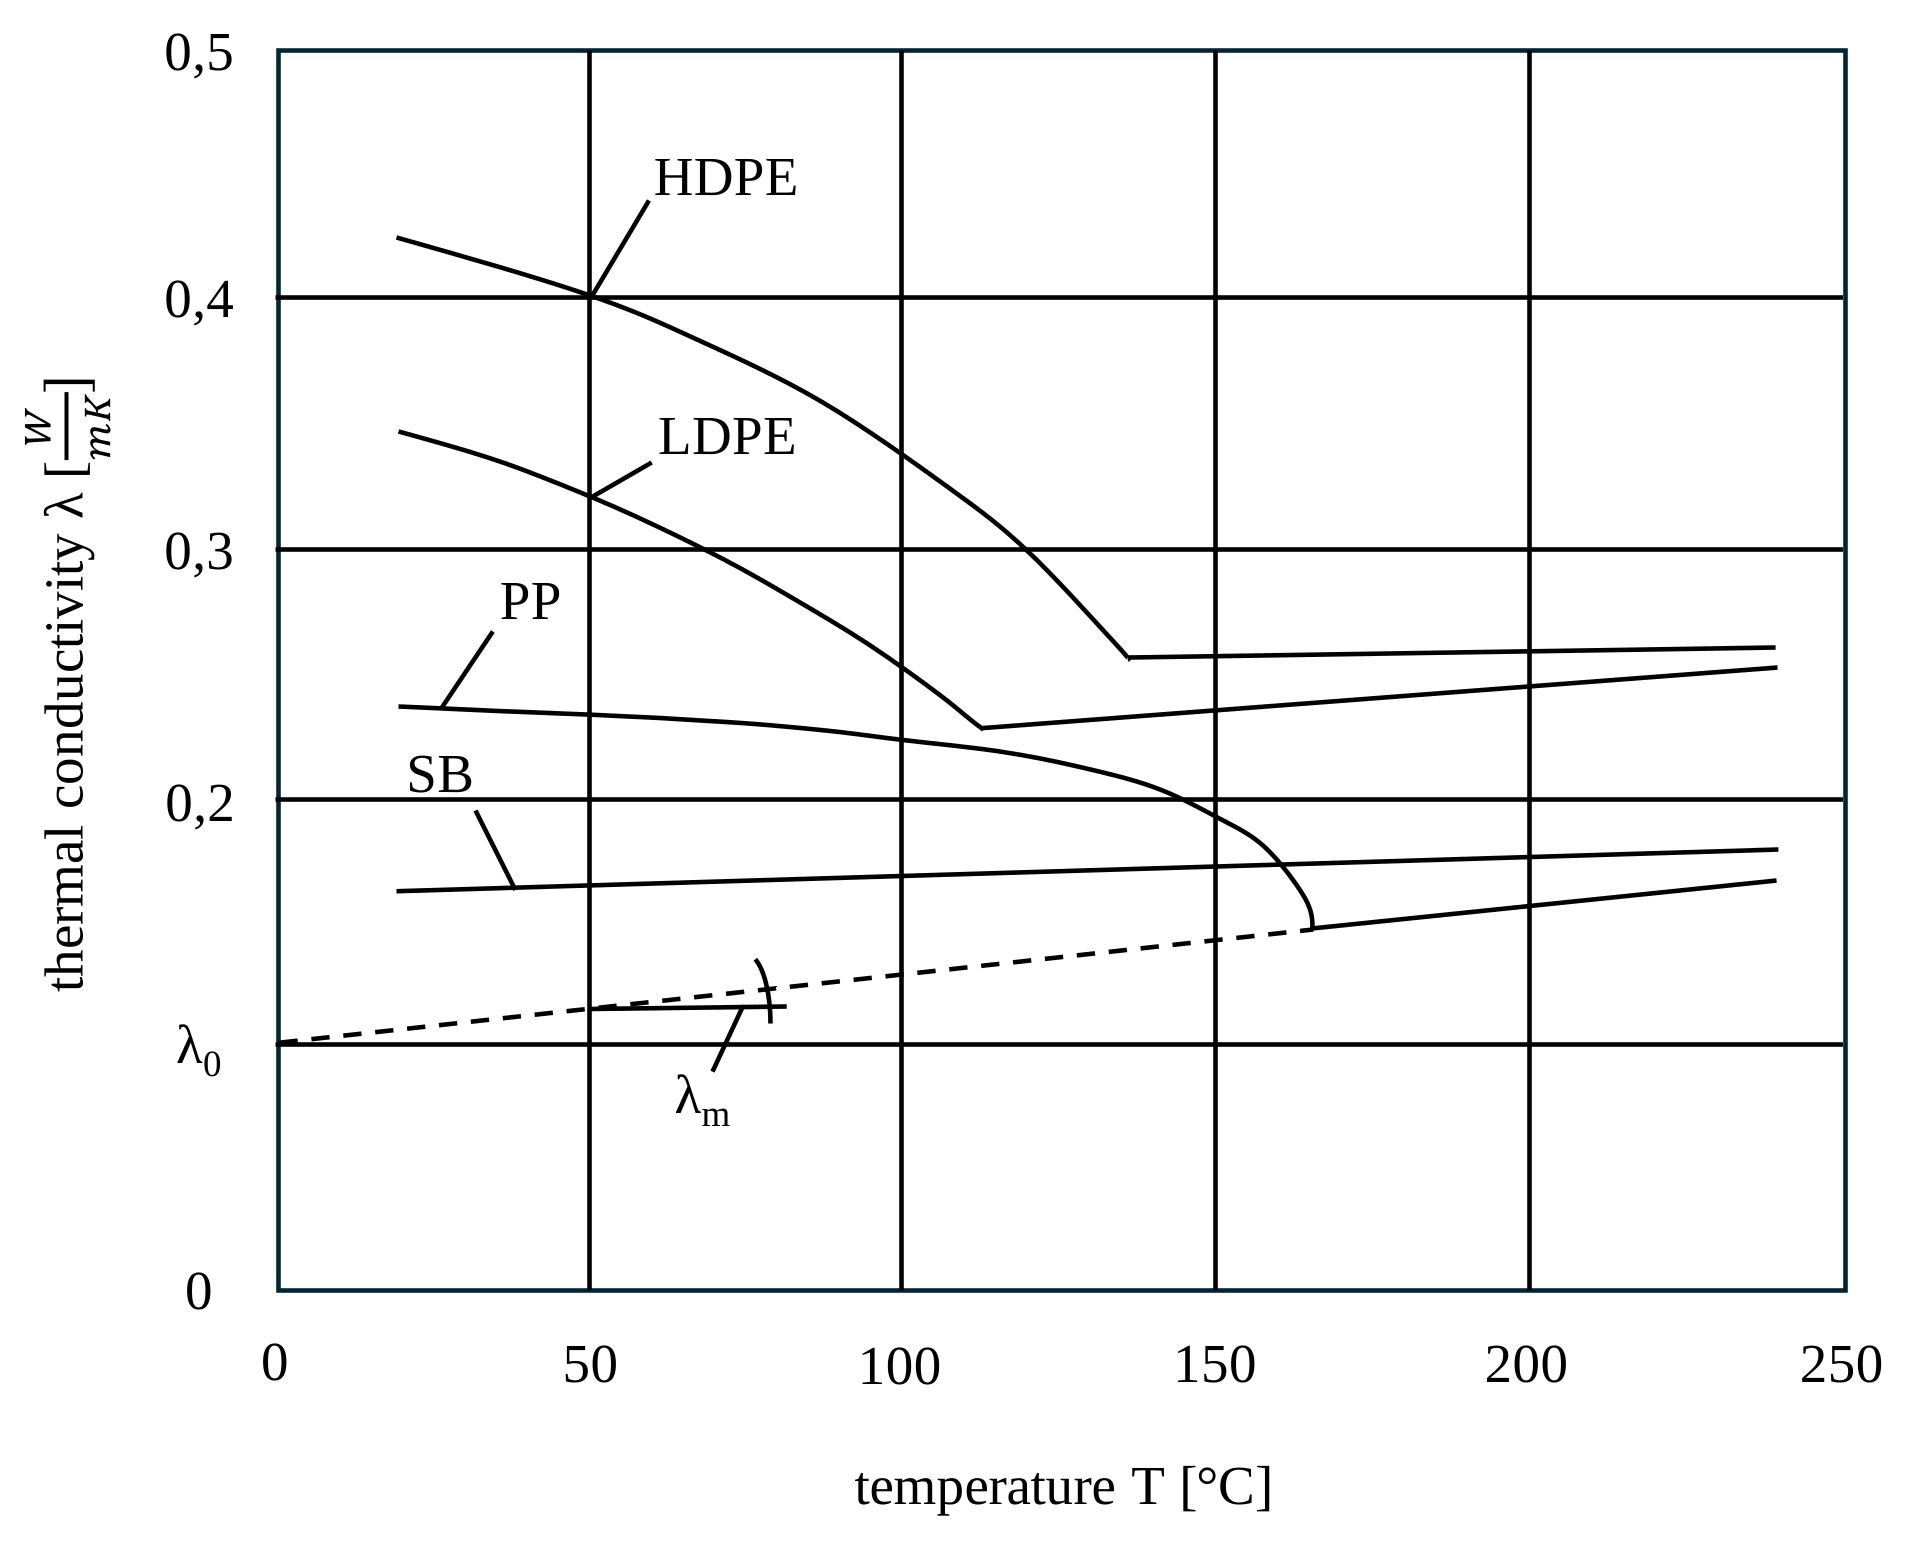
Thermal conductivity
\[λ(T) = λ_0 + λ_m \cdot T\]
$λ_0$ represents the thermal conductivity resulting from the straight line describing the melt range at 0 °C. The gradient of the thermal conductivity $λ_m$ can also be negative and must then be entered with a negative sign. The effective thermal conductivity of the solid is required for the melting calculation. To determine this value, the thermal conductivity of the solid $λ_F$ must be entered.
Specific heat capacity
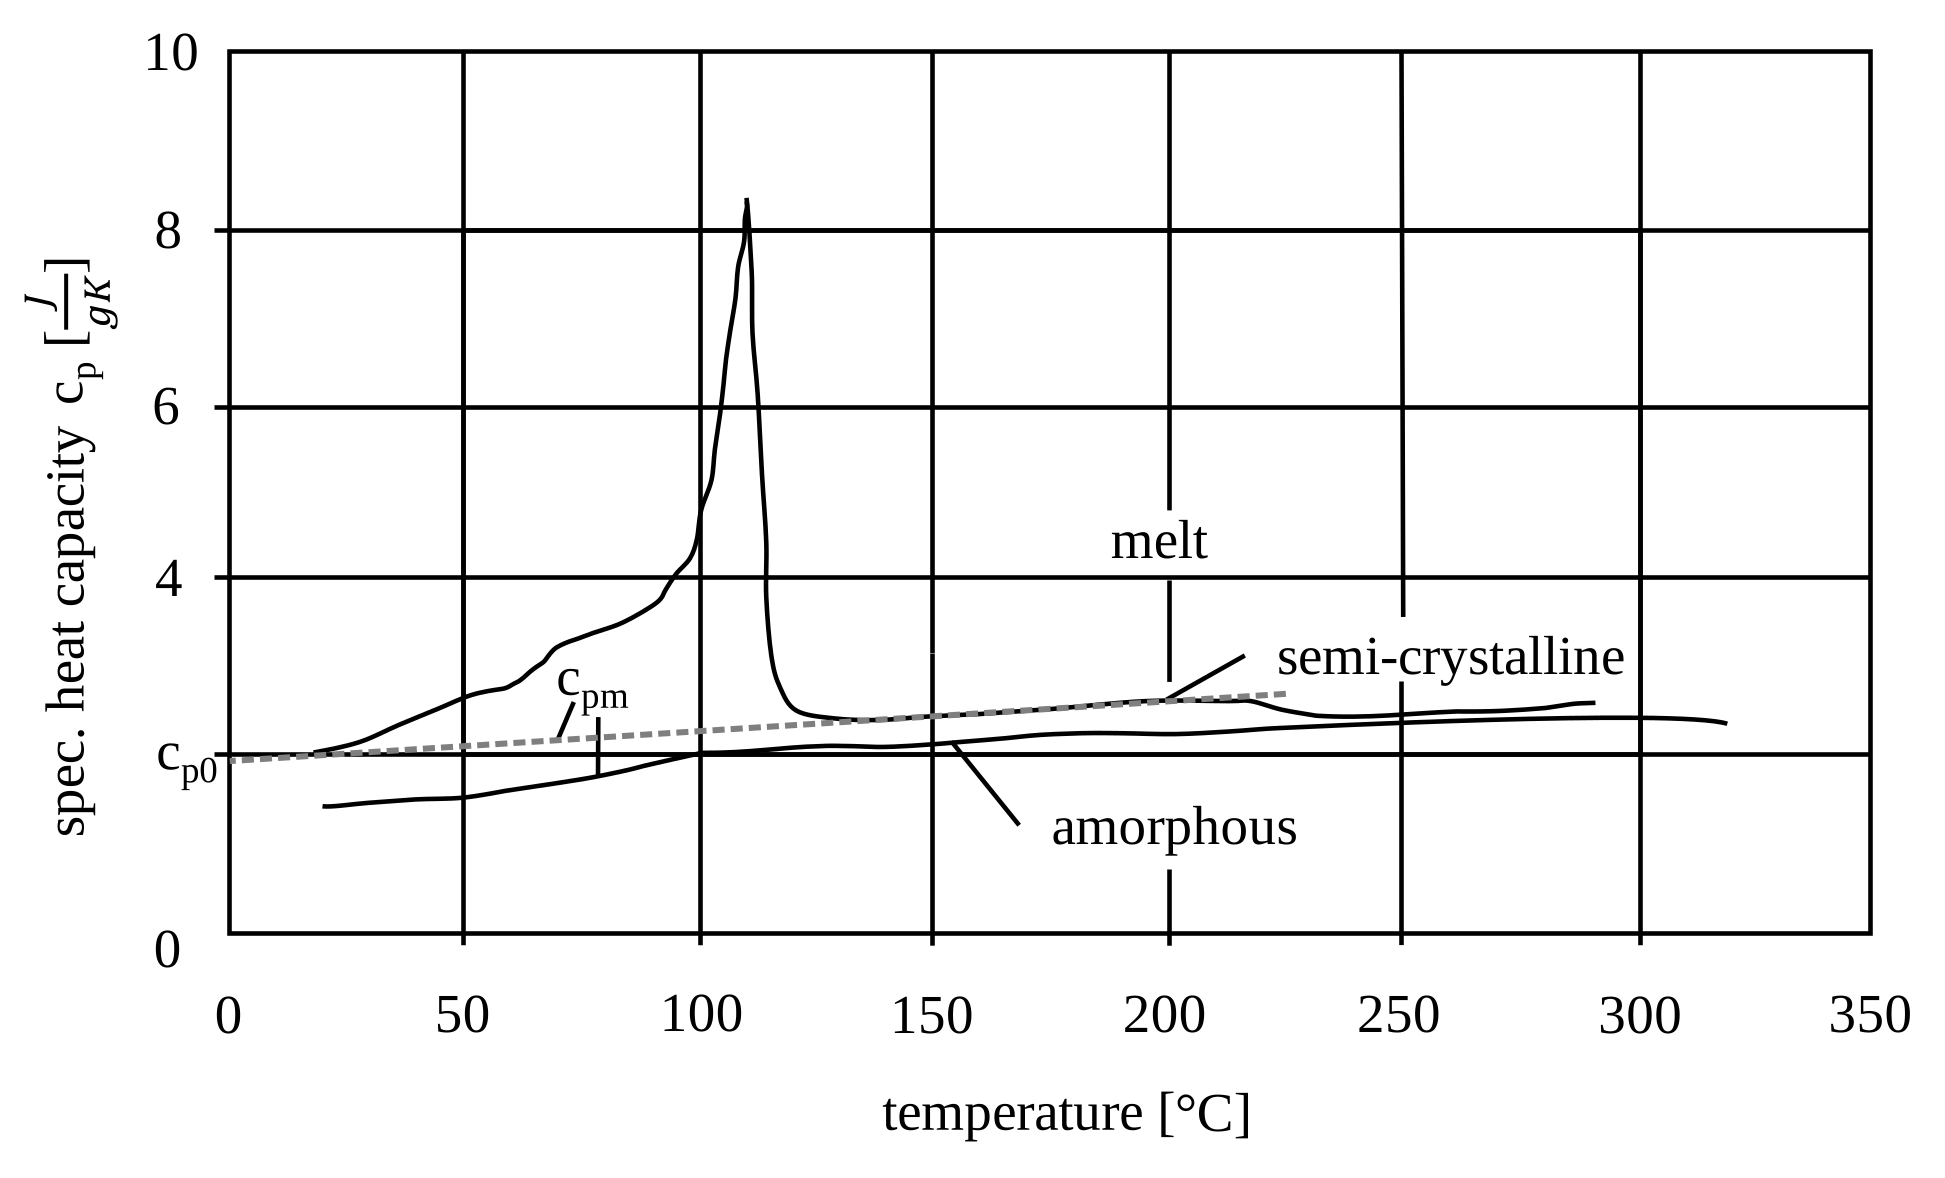
The function curve of the specific heat capacity $c_p$ at ambient pressure is shown for amorphous and semi-crystalline thermoplastics in the following figure. In the melt range, the specific heat capacity behaves almost linearly and can therefore be calculated using a linear equation:
\[c_p(T) = c_{p,0} + c_{p,m}\cdot T\]
The peak in the curve for semi-crystalline thermoplastics describes the temperature $T_K$ and thus the melting temperature.
Specific Enthalpy
The specific enthalpy results from the integral of the specific heat capacity $c_p (T)$ between the limits $T_1$ and $T_2$:
\[Δh = \int \limits_ {T_1}^{T_2} c_p(T)dT\]
This gives the amount of heat related to the unit mass that is required to increase the temperature of the polymer from $T_1$ to $T_2$.
In contrast, semi-crystalline materials exhibit a step-like increase due to the phase transition. The additional amount of heat is referred to as the melting enthalpy $∆h_A$. The following figure shows the specific enthalpy as a function of temperature.
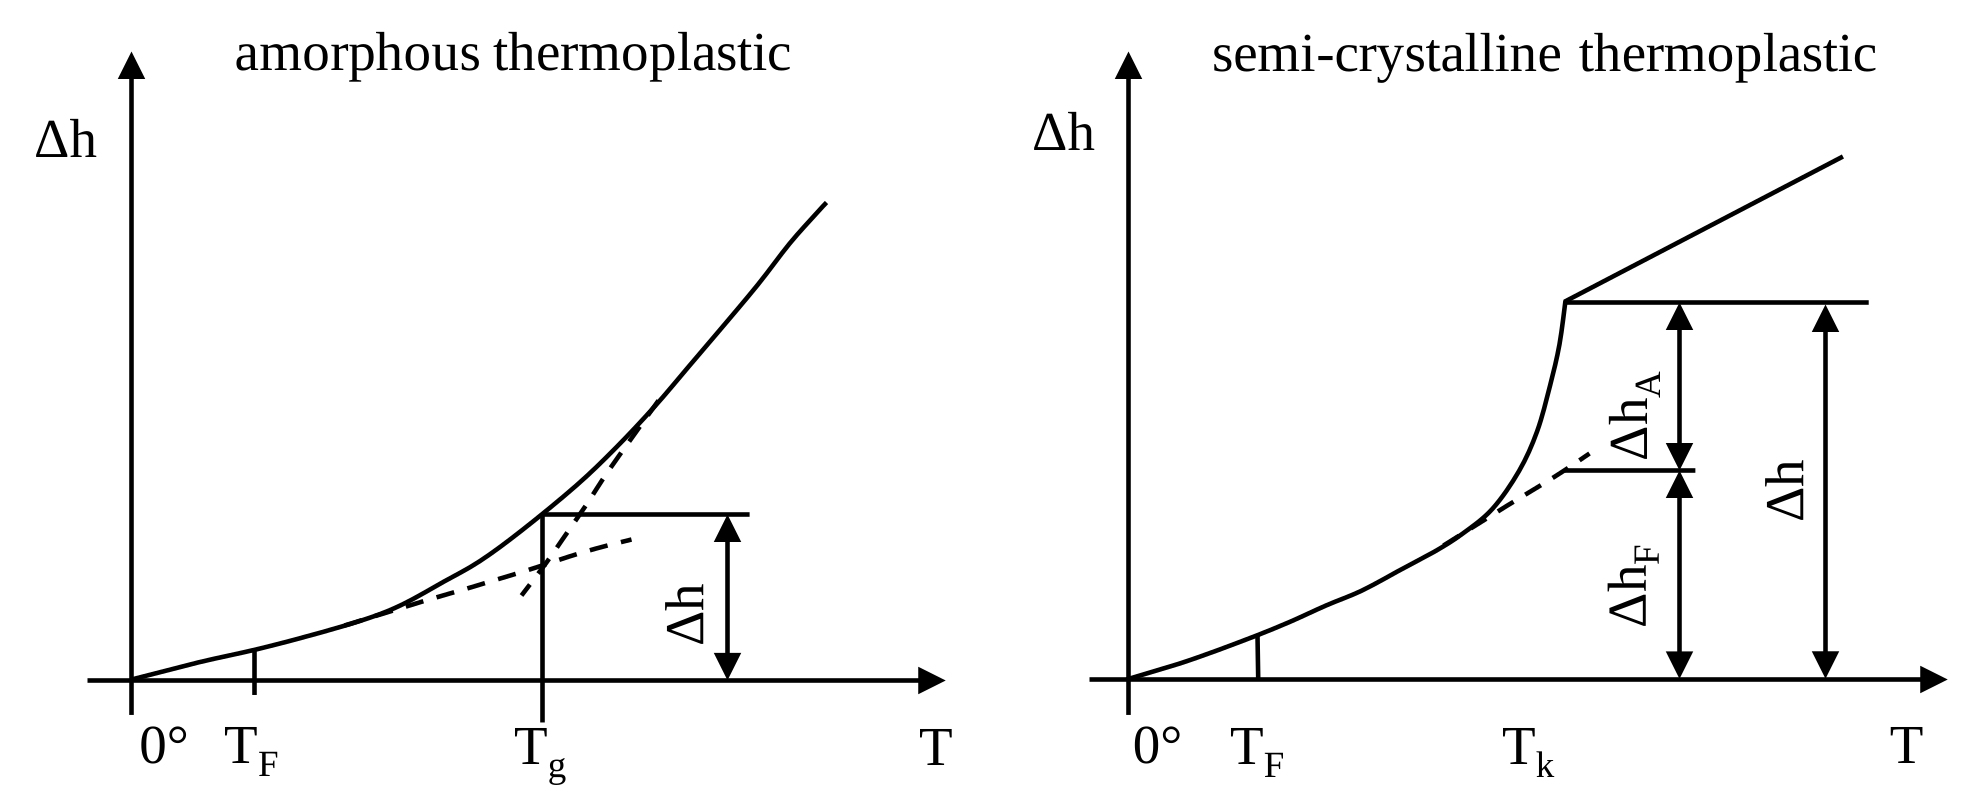
When specifying an amorphous thermoplastic, the field for the melting enthalpy is not editable. For semi-crystalline thermoplastics, the enthalpy increase $∆h$ consists of the enthalpy increase of the solid phase $∆h_F$ and the melting enthalpy $∆h_A$:
Amorphous thermoplastics: \[∆h_{T_G}=∆h_F\]
Semi-crystalline thermoplastics: \[∆h_{T_K}=∆h_F+ ∆h_A\]
Plus the enthalpy increase in the melting range: $$∆h_{melt}=\frac{1}{2} c_{p,m} \cdot (T^2-{T_{K,G}}^2) + c_{p,0} \cdot (T-T_{K,G})$$