Dies ist eine alte Version des Dokuments!
Printing

Printing
Printing can be done via the Toolbar,

Project→Print or via Ctrl + P. A menu opens with the Print settings.
PDF files can also be created using a ‘pdf printer’.
Page settings
The paper, portrait or landscape format and distances to the edges can be selected here
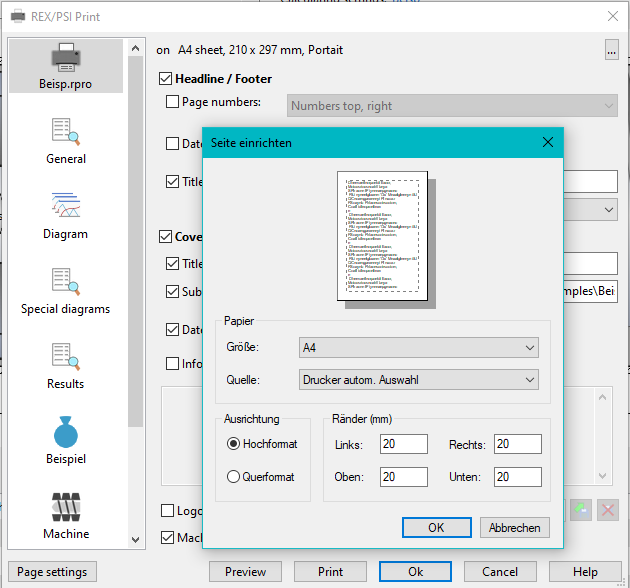
- Preview: opens a print preview
- Print: Starts printing
- OK: Closes the menu, changed settings are saved
- Cancel: Closes the menu, changed settings are not saved
- Help: opens these instructions
Settings
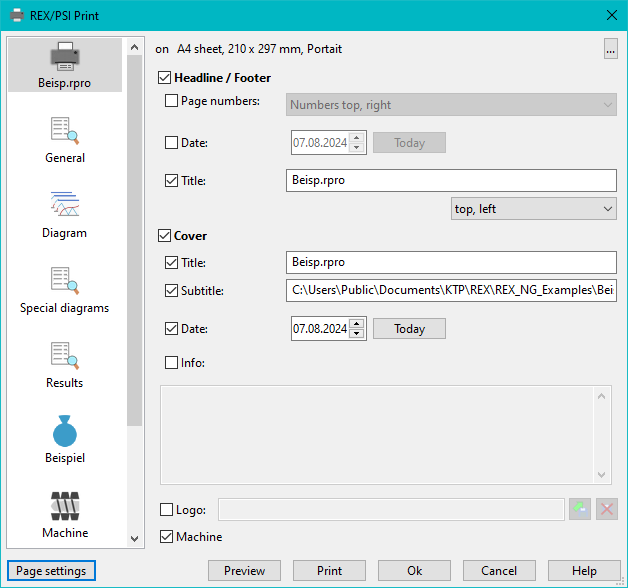
The header, footer and cover page can be configured in the top tab (here „Dzs.ppro“).
All subsequent tabs correspond to a new sheet in the printing process and can be customized or deactivated for printing.
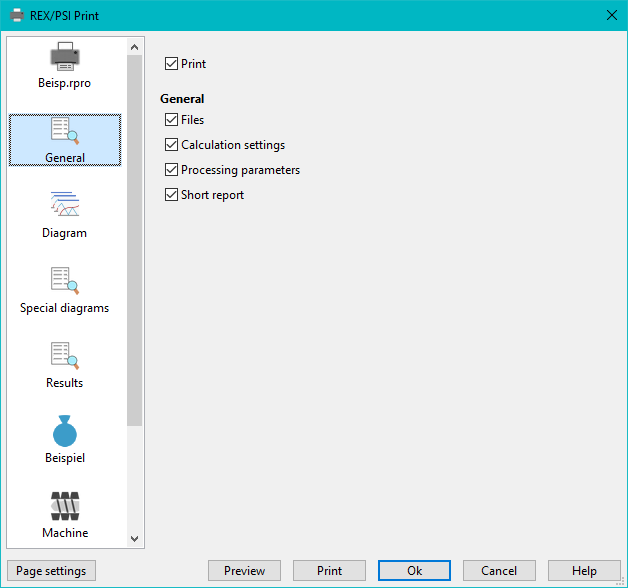
General
General information on the process and a short report on the results can be printed out here.
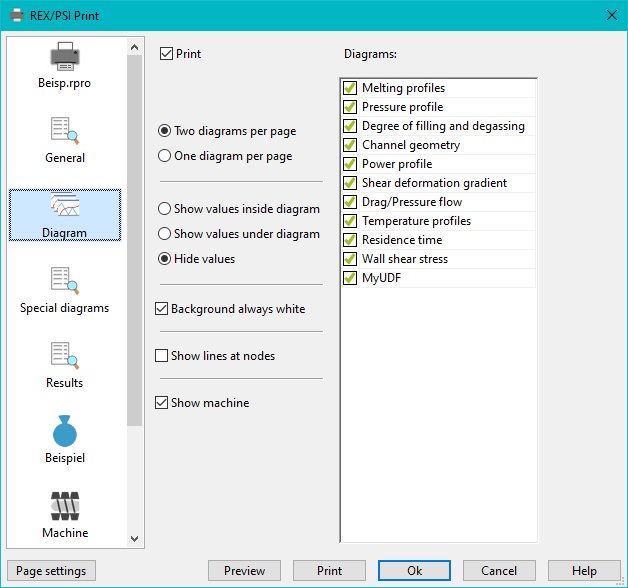
Diagram
All diagrams that can be displayed during the process can be selected and configured here.
Other diagrams
Diagrams that are not curves can be selected here. In PSI, comparison diagrams for front/rear screw position can also be selected here.
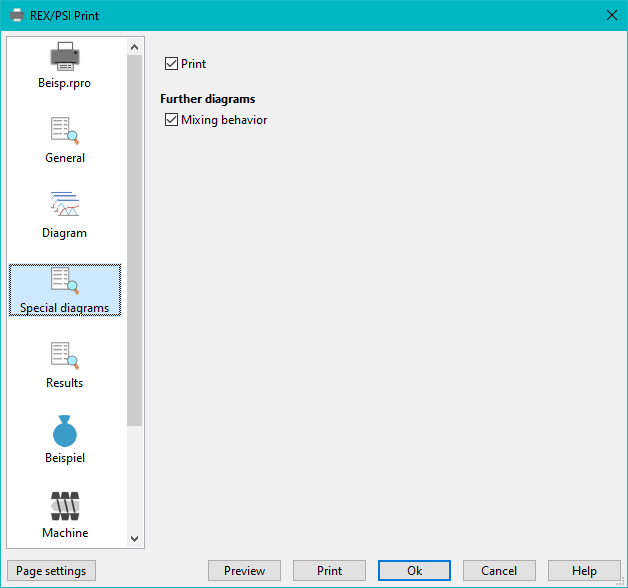
Results
Lists of results for the diagrams and user-configured result lists can be selected and printed here.
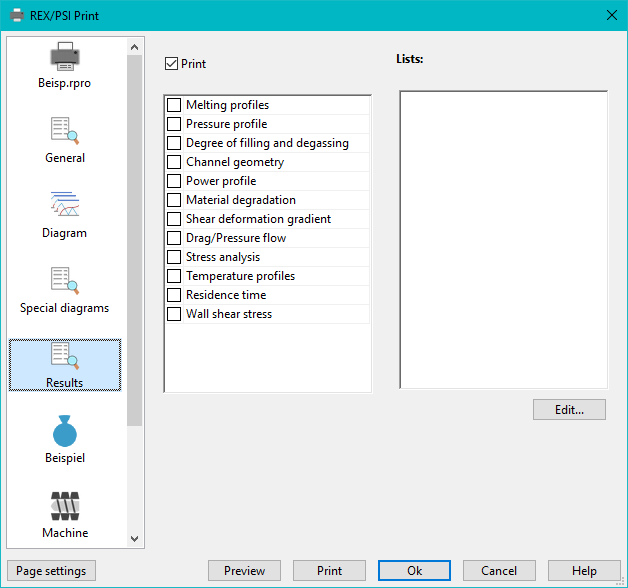
Material
Information of the material can be selected here.
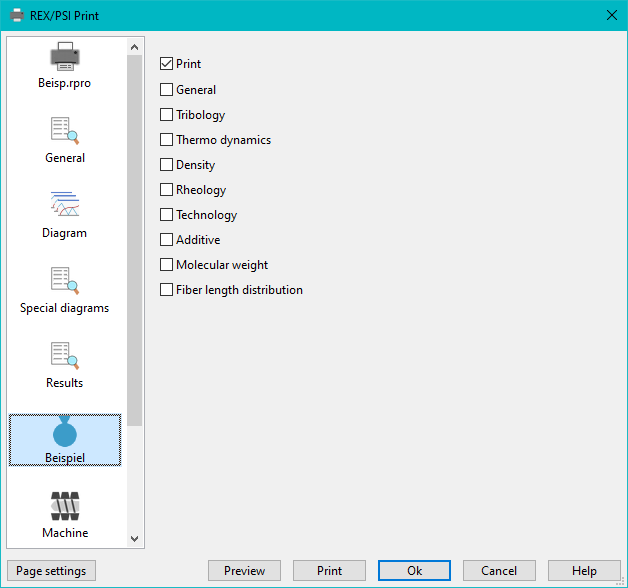
Machine
Here you can select partial areas of the machine, a full-page overall view and details of individual screw zones.
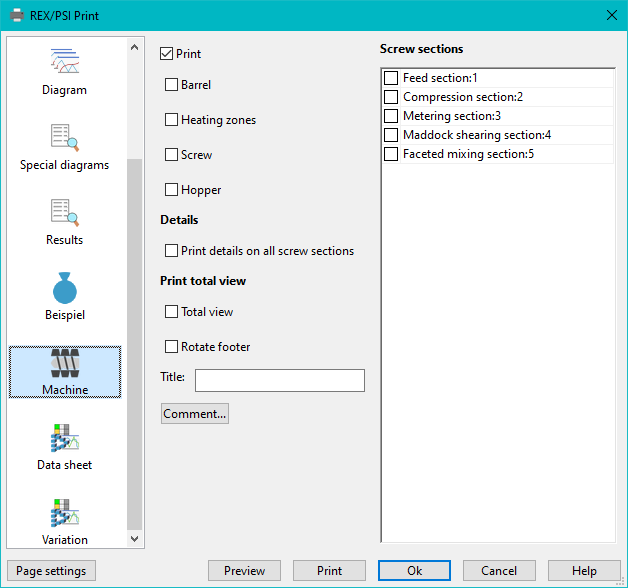
Measuring sheet
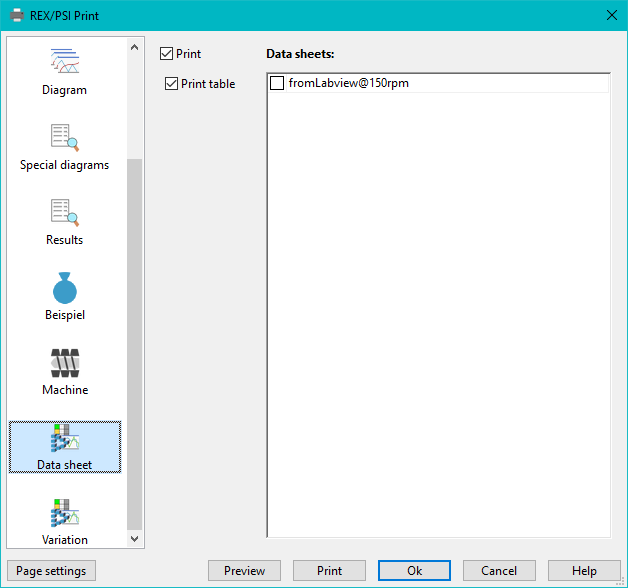
Measurement sheets can be selected for printing here.
Variation
Hier können Variationen zum Drucken ausgewählt werden.
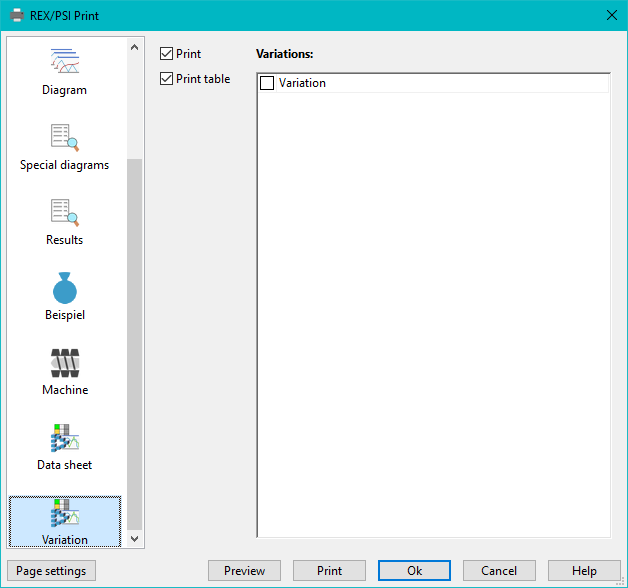
Diagramme Drucken
Eine weitere Möglichkeit Diagramme zu drucken ist ein Rechtsklick aufs Diagramm und im dann erscheinenden Menü Drucken auszuwählen. Hierbei wird nur das Diagramm ausgedruckt.
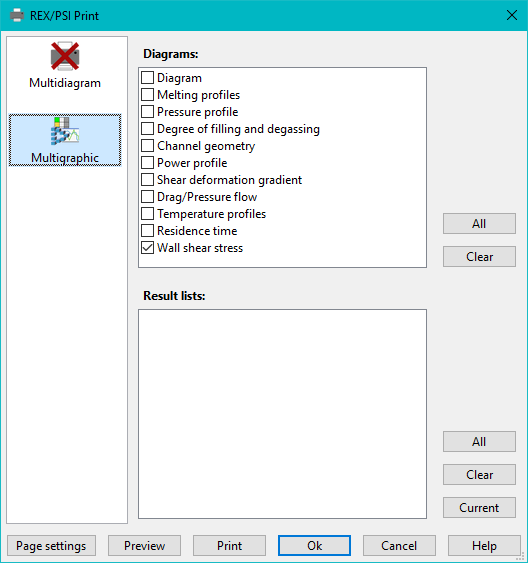
Multigrafik
Hier können aktuell dargestellte Diagramme und Ergebnislisten aus der Multigrafik gedruckt werden.
Faserlägenverteilung
Hier können die Teilbereiche der Faserlängenverteilung zum Drucken ausgewählt werden. Funktionsweise Längenverteilung: Es werden bis zu 4 Diagramme je Seite gedruckt. Die Eingaben „von“ und „bis“ sind die Positionen des ersten und des letzten Diagramms, die anderen liegen in gleichen abständen dazwischen.