Dies ist eine alte Version des Dokuments!
Melting profile
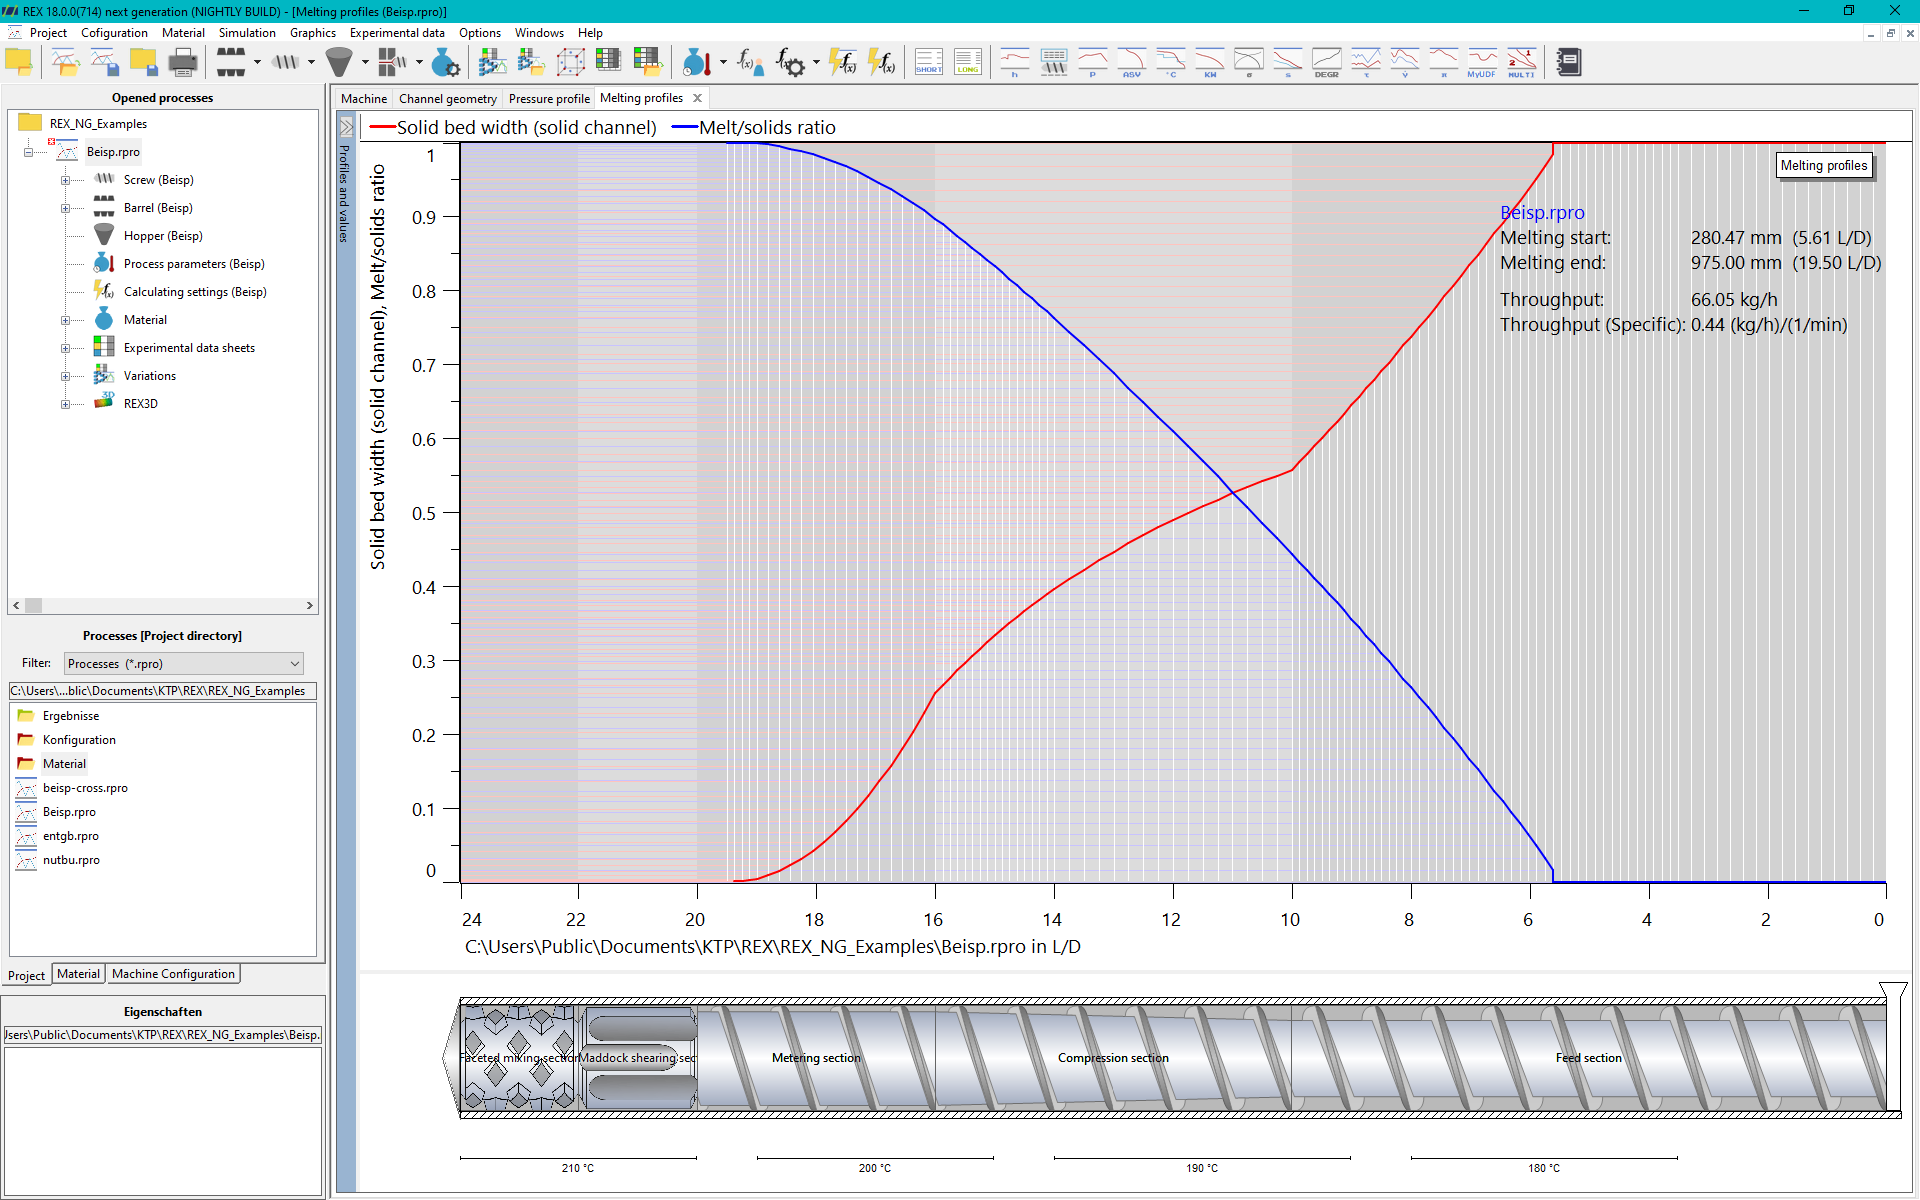
The graph of the melting process (ASV) visualises the results of the calculations on the melting behaviour during the plasticising process in the single-screw extruder. The screw length is plotted on the x-axis, while the y-axis represents the dimensionless solid bed width (Y). This is defined as the ratio of the solids bed width to the channel width of the screw flight and can assume values in the range from 0 to 1.
Interpretation of the curves:
Plastifizierphase
- The dimensionless solid bed width is represented by the red curve.
- The melted mass fraction is represented by the blue curve.
End of the standstill phase (PSI)
- The dimensionless solid bed width is represented here by the red curve.
- The melted mass fraction is shown by the blue curve.
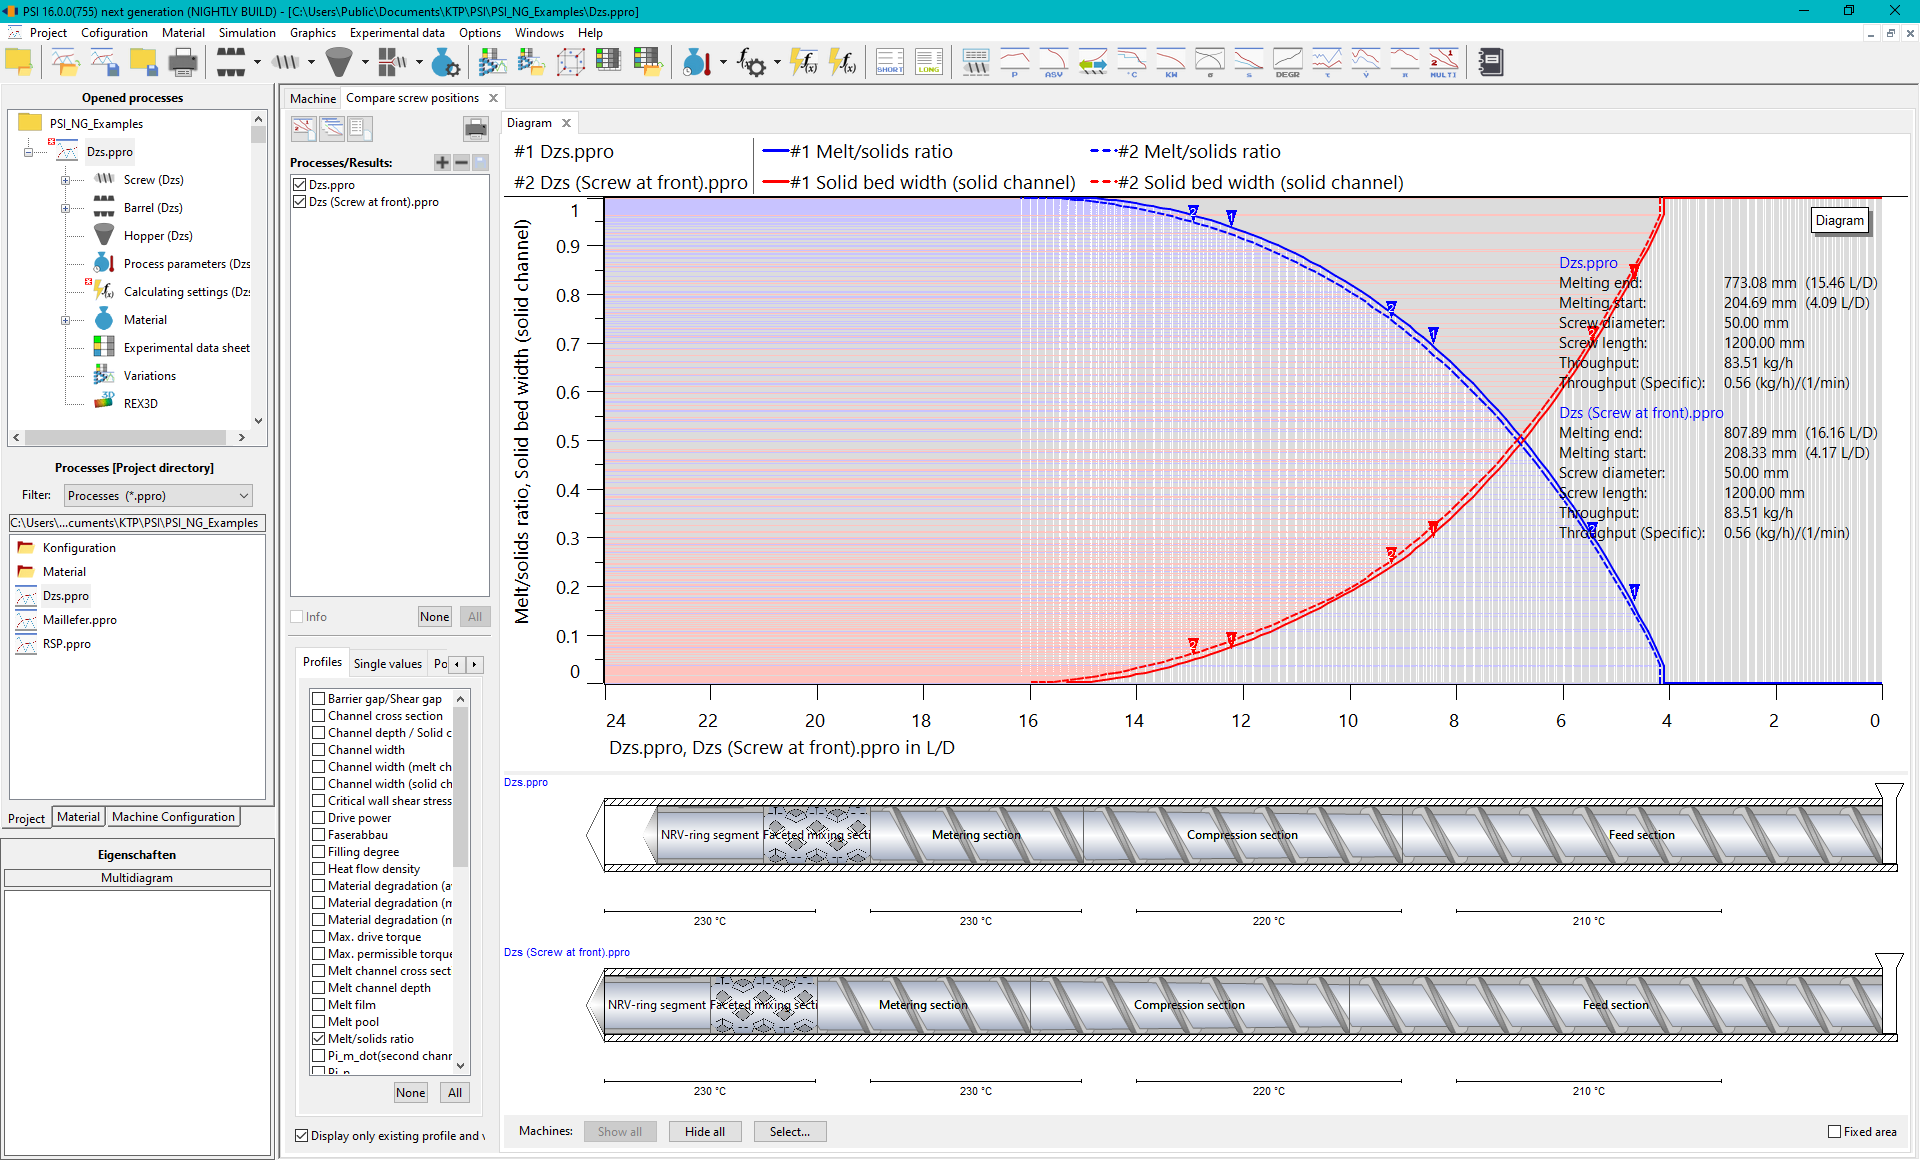
Melting curve front/rear (PSI)
The PSI-specific menu item Compare screw positions displays the melting curve for the front and rear screw positions. The same applies to the display of the two curves as for the normal melting curve. The only difference is that the two curves are plotted one below the other in two graphs. The screw moves between the front and rear position during a cycle in the injection moulding process. For this reason, this menu item allows you to view the melting curves calculated for the two screw positions in one graph.
Peculiarities of the melting process
During the plasticising process, characteristic jumps occur in the melting process, which can be caused by various factors:
- Cyclical interruptions in screw rotation: These interruptions, especially in the standstill phase, can lead to sudden changes in the melting rate, which can be seen in the graph by abrupt jumps.
- Geometry changes between zones: Changes in screw geometry, such as a change in pitch or number of flights between zones, will result in a variation in flight width. This variation directly influences the Y-value (dimensionless solid bed width), which can lead to a sudden increase or decrease.
Dangers with poorly melting polymers
For polymers with a high enthalpy that are difficult to melt, undesirable effects can occur in conjunction with early or strong compression. A particular risk is that the Y-curve reaches the value 1, which means that the solid bed width occupies the entire channel width. This occurs when the polymer expands strongly under the strong compression. If the value Y = 1 is reached, the calculation is automatically cancelled at this point.
Melting process for degassing screws
In screws that have a degassing zone, the melting process is calculated up to the degassing opening. After this zone, the melting process can only continue if the melted granulate is in a sufficiently small state so that it can easily pass through the gap in the shear elements. However, if the granulate is too large in diameter, it will block the shear elements and the melting process will also be cancelled at this point.
Representation of the start and end of melting
Two crucial points are emphasised in the ASV diagram:
- The start of melting, which marks the place where the first melt vortices occur in the solid bed.
- The melting end, which does not necessarily mean that the entire material is completely melted. This point marks the end of the calculation process, which is achieved either by complete melting or by one of the conditions mentioned above (e.g. Y = 1 or blockage of the shear parts).
It is important to note that the actual end of melting is not always an indication that the entire material flow has been completely plasticised. Instead, the graph shows the last point for which the calculation could still be performed validly.