Dies ist eine alte Version des Dokuments!
Pressure profile
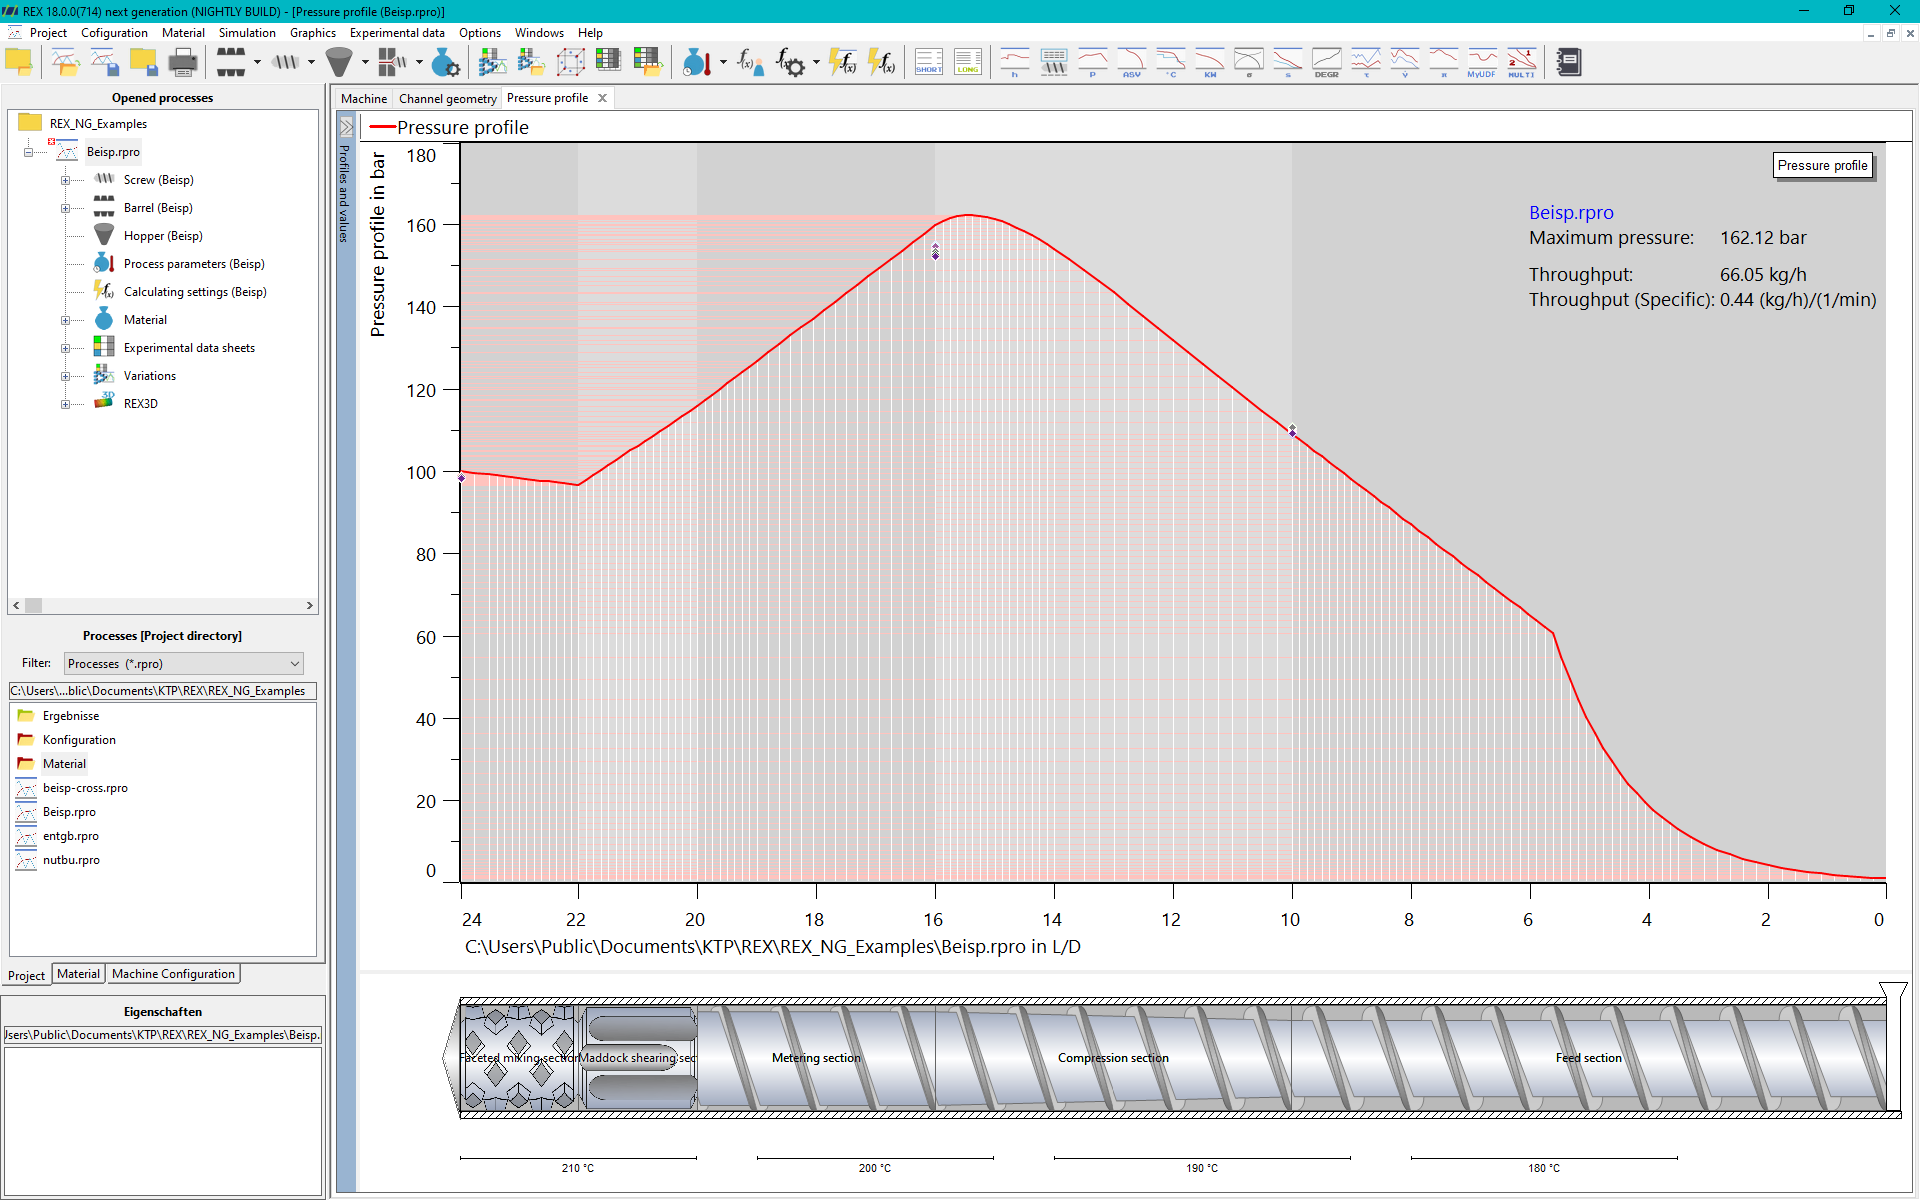
Representation of the pressure curve
Interpretation of the curves
- ** Red curve**: In this standard diagram, only the pressure curve is shown. The specified pressure is present at the tip of the screw. The pressure curve is calculated from the screw tip back to the location of the melt vortex formation. An exponential pressure curve is assumed from the pressure at this point to the pressure at the front edge of the funnel.
Analysing the pressure curve
Both the maximum pressure in the extruder and the location of the maximum pressure can be seen in the pressure curve. It is also possible to see how the respective screw zones affect the pressure-throughput behaviour. The pressure curve can be analysed in particular using the dimensionless drag and pressure flow.