Dies ist eine alte Version des Dokuments!
Long report
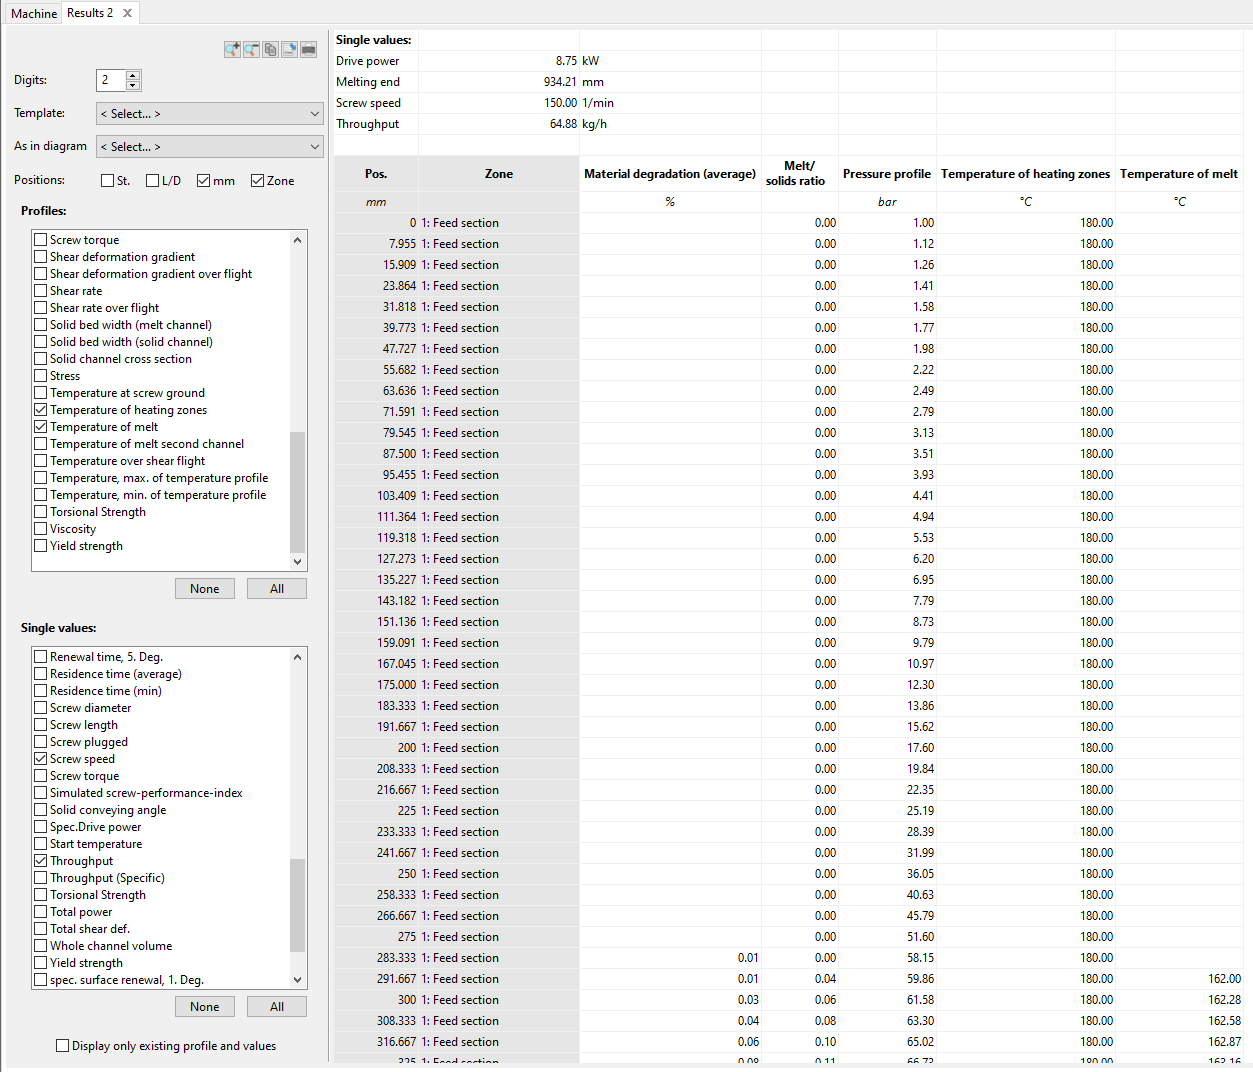
The long report can be opened via the ‘Long’ button or via ‘Simulation → Long report’.
The long report is highly customisable, so that the variables relevant to the user can be viewed and also exported.
The following functions can be called up via the button bar at the top of the selection window:
- Enlarge the view
- Reduce the view
- Copy data to clipboard (shortcut Ctrl+C, is saved to clipboard in csv format)
- Save as .csv file
- Print table
Two functions are provided for quick setup of the long report:
- A specific selection of progressions and individual values can be named and saved as a template as well as loaded (see Result Lists).
- The selection can be set to the default setting of a diagram (example: curves and individual values as in the temperature diagram)
Up to four options can be selected to identify the grid points:
- St.: Number of the interpolation point (e.g. 0 to 150)
- L/D: Position of the interpolation point as a multiple of the screw diameter (e.g. 0 L/D to 33 L/D)
- mm: Position of the support point in mm (e.g. 0 mm to 1800 mm)
- Zone: Listing of the screw zone at the corresponding support point
All courses calculated in REX/PSI can be selected. The values of the corresponding curve are displayed as a column in the table across all interpolation points for which values are available. For example:
- Pressure curve
- Temperature of the melt
- Temperature of the melt in the second channel
- Temperature of the heating zones
- Temperature at the bottom of the screw
- Maximum temperature of the temperature profile
- Minimum temperature of the temperature profile
- Melt content
- Viscosity
- And many more
In addition, individual values can be selected, which are listed in the upper part of the table. For example:
- Throughput
- Specific throughput
- Start of melting
- Melting end
- Screw diameter
- Screw length
- Final temperature
- Drive power
- And many more