Dies ist eine alte Version des Dokuments!
Multigraphics
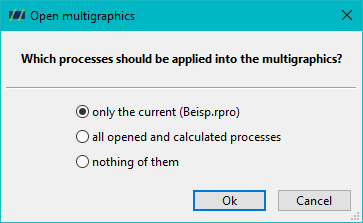
If you want to compare several processes with each other in REX/PSI, you can use the multigraph function. You can open this via the toolbar. After opening it, you will first be asked which processes are to be included in the multi-graph. Here you have the choice between the currently open process, all processes previously opened in REX/PSI or no transfer of processes. Confirm your selection with ‘OK’, whereupon a new window opens.
This new window is divided into three areas. In the top left-hand area, you can add or remove various processes. The bottom left-hand area gives you access to all processes and individual values, which you can select or deselect as required. The entire right-hand area of the window displays the individual diagrams and machines, which you can customise. For example, if you have added two processes, both machines are displayed below the diagram. These machines can be shown and hidden individually by clicking on the blue hyperlink of the file name. Optionally, you can use the ‘Hide all’ or ‘Selection’ buttons to control the selected machines.
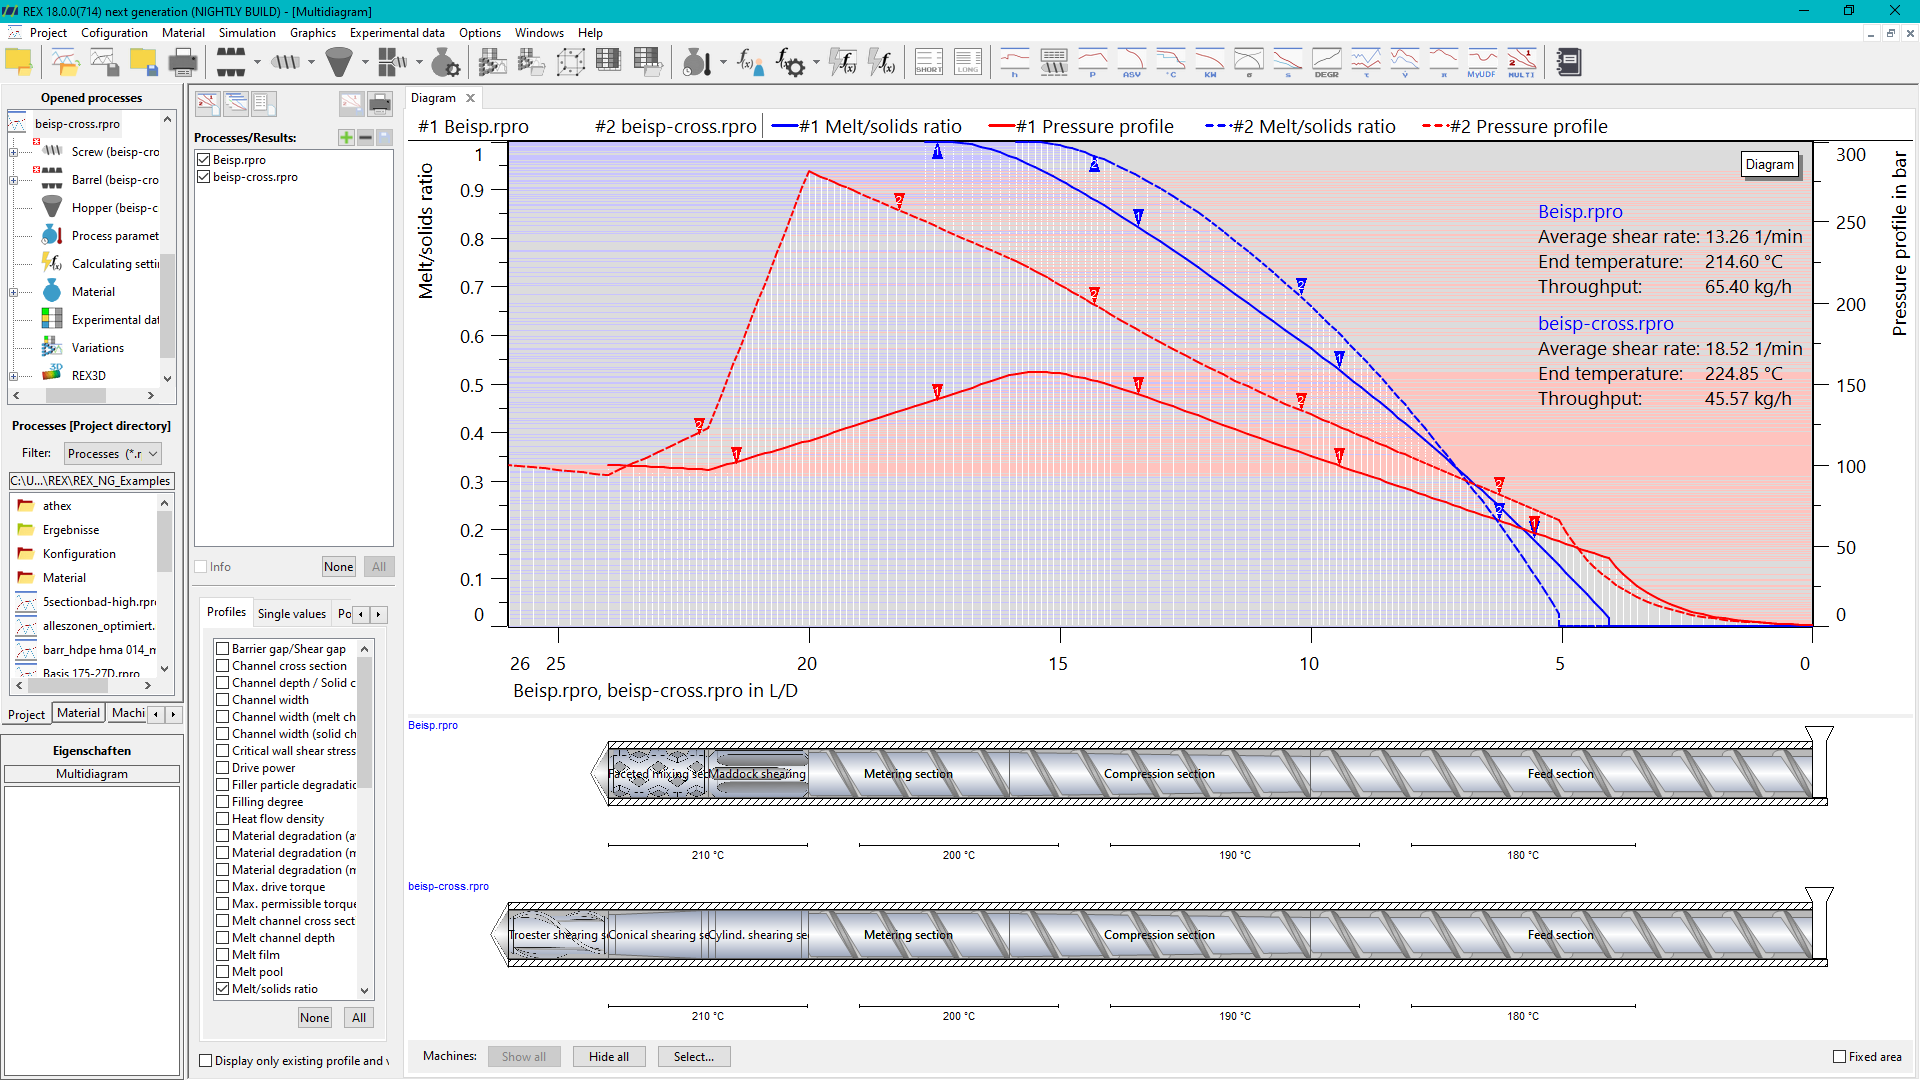
Right-clicking on a machine allows you to customise the X-axis scaling according to your preferences. You have the choice of defining a common axis for all machines, so that they are displayed to scale, or defining a separate X-axis for each machine, so that the machines are scaled to maximum size. You can also use this context menu to save the diagram as an image file or make individual diagram configurations.
If you open the diagram settings, you can adjust the diagram colours and structures according to your wishes, as in the options. The multigraph also offers buttons at the top that allow you to add various functions. Use the ‘Add new diagram’ button to create an empty diagram area in which neither machines nor gradients are selected. The ‘Open all standard diagrams’ button opens all known standard results and lists them in various tabs. You can also use the ‘Add new results list’ button to create a text-based display of the results, which can also be configured according to your requirements. A results list can also be exported as a CSV file to enable further processing in Microsoft Excel.
Finally, the ‘Print diagrams and gradients’ button allows you to print out the entire diagram settings and put them on paper.