Dies ist eine alte Version des Dokuments!
Treatment of Mixtures
Simulating Mixtures
In REX/PSI Next Generation, you can compare different materials by creating variations of components and visualizing the corresponding results. The following guide provides a detailed description of how to perform this in the software.
Step 1: Open the Variation manager and Create a variation
To begin analyzing different materials, first open the Variation manager. This section of the software allows you to perform various simulations by altering specific material properties or other parameters.
Navigate to the main menu under Experimental data > Variations manager. Click on Add new variation to begin a new variation. In this window, you have the option to select different materials and components for comparison. Name the new variation in a way that describes the project and the materials being simulated, so that you can easily identify the different variation experiments.
Step 2: Add new control factors and select material for exchange components
Once the variation is created, you can define the parameters to be varied.
Click on Add New Control Factor. To do this, open the Factors tree and double-click on the corresponding control variable.
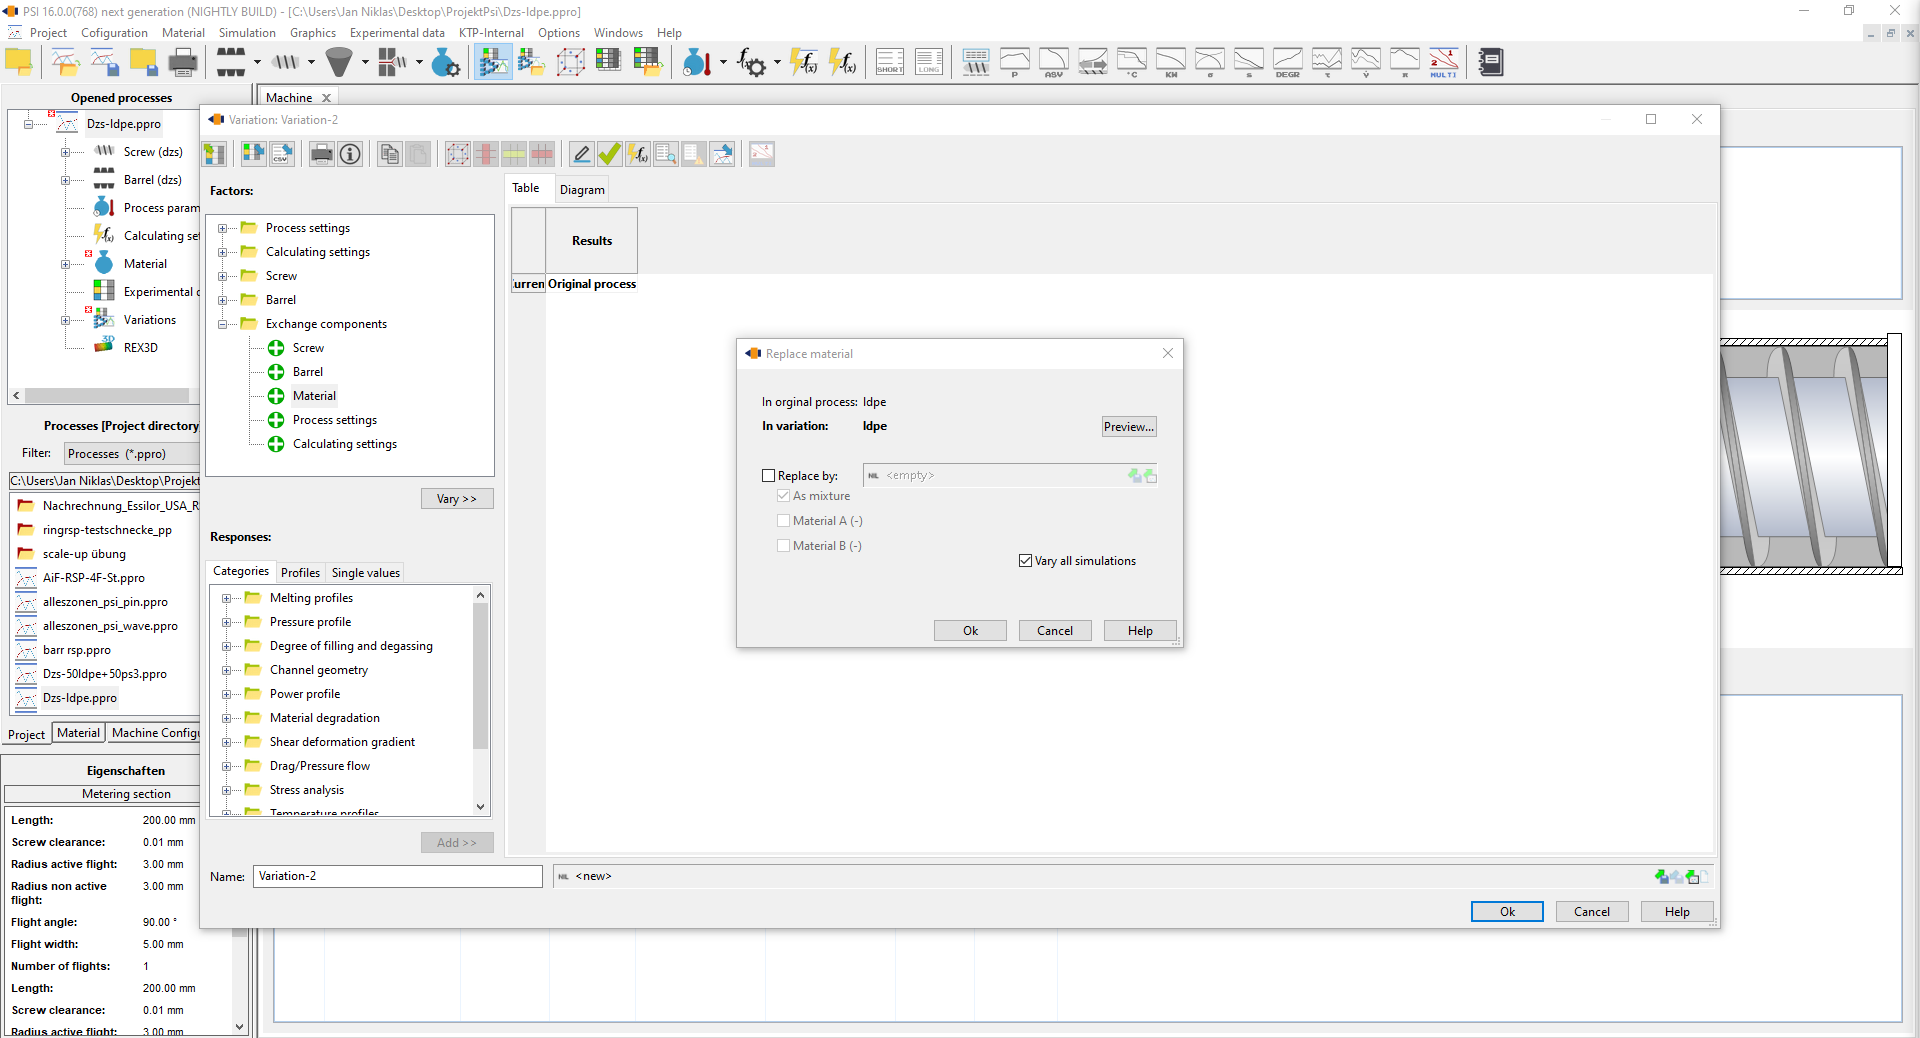
From the displayed options, select Exchange components > Material. This allows you to replace a material within the process and analyze the effects. Now, select the material you want to use in this variation. You can either access a material already stored in the material database or create a new material. Repeat this step if you want to compare multiple materials.
Step 3: Perform calculation and select results
Once the material variations have been defined, the simulations need to be calculated to obtain the results of the different variations.
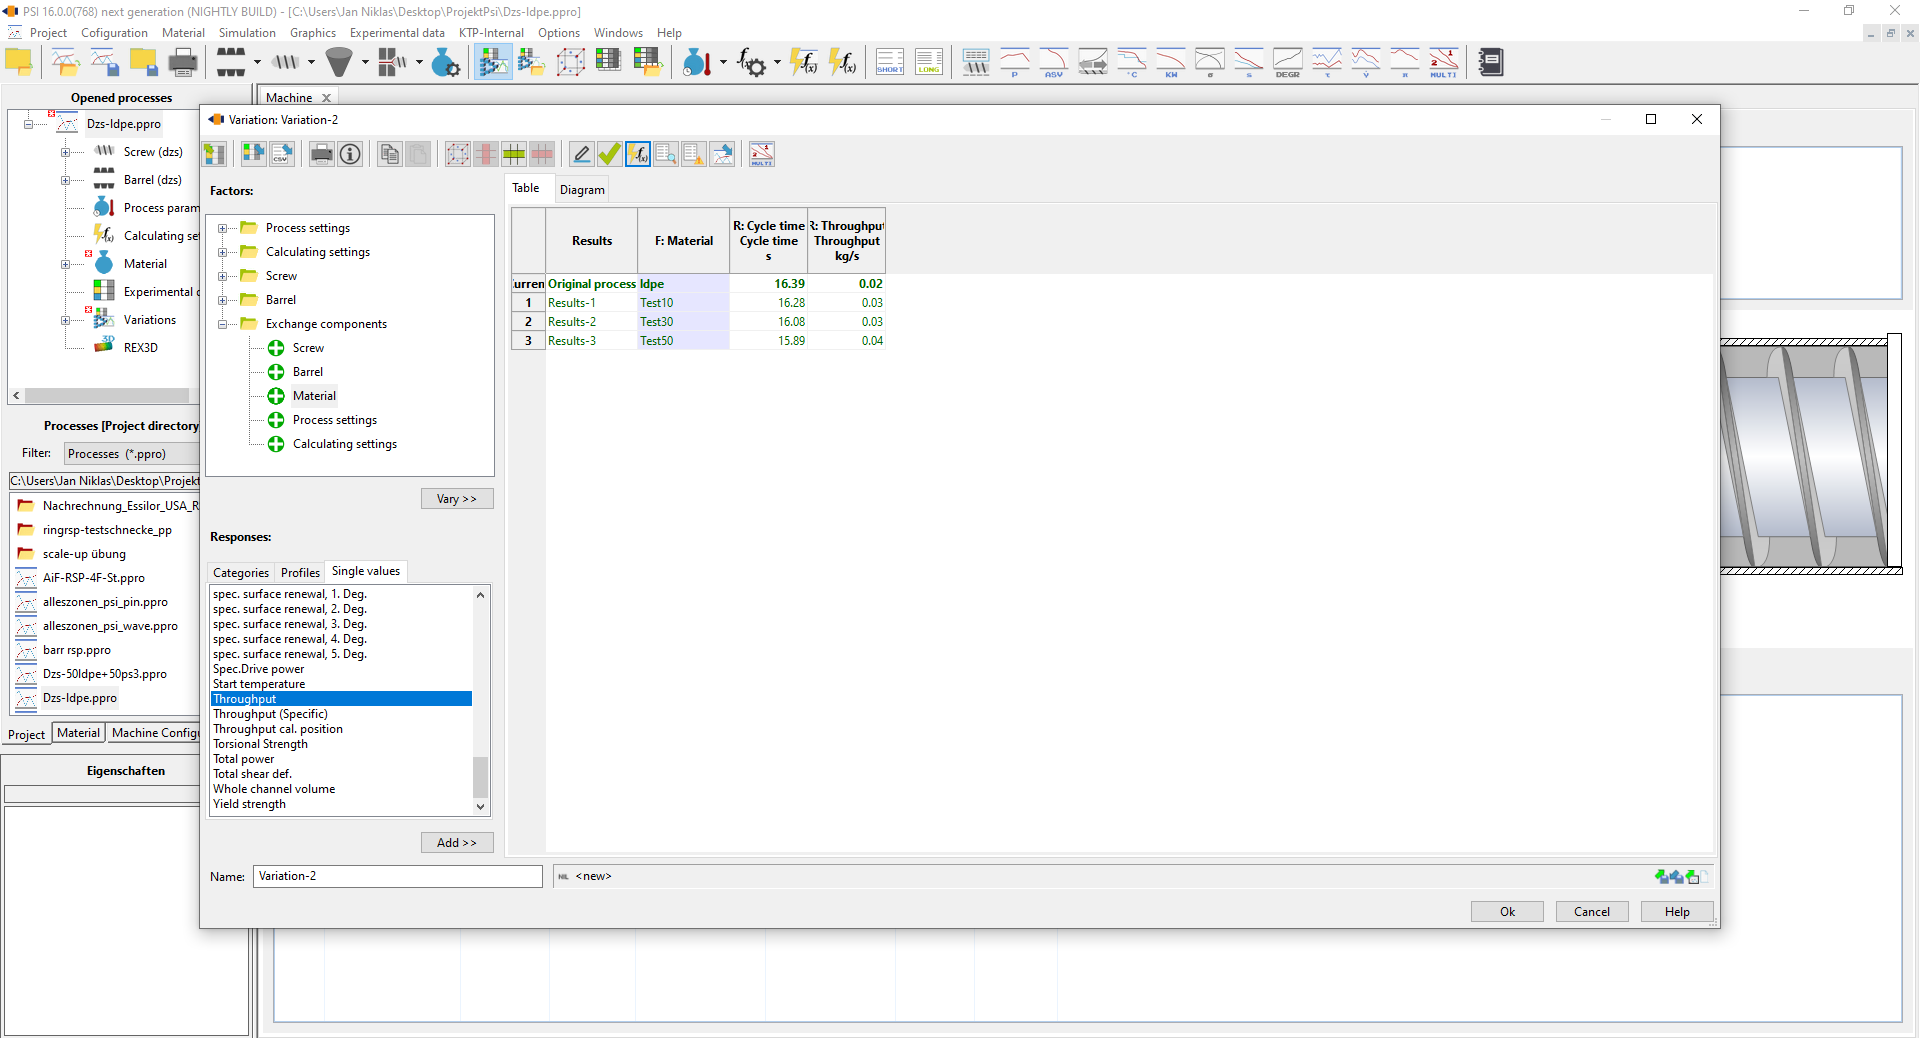
Click the Calculate all button to start the simulation. The software will perform calculations for each variation and generate results based on the modified material properties. To display the results of the calculations, click on Add new Responses Value out of the responses tree. In this section, you can select exactly the results you want to display. Choose the target values relevant to your analysis by selecting them from the list of available results.
Step 4: Display graphs of the different variations
Once the calculations are complete and the target values have been selected, you can visually display the results in the form of graphs. This allows you to clearly see and compare the effects of the different material variations.
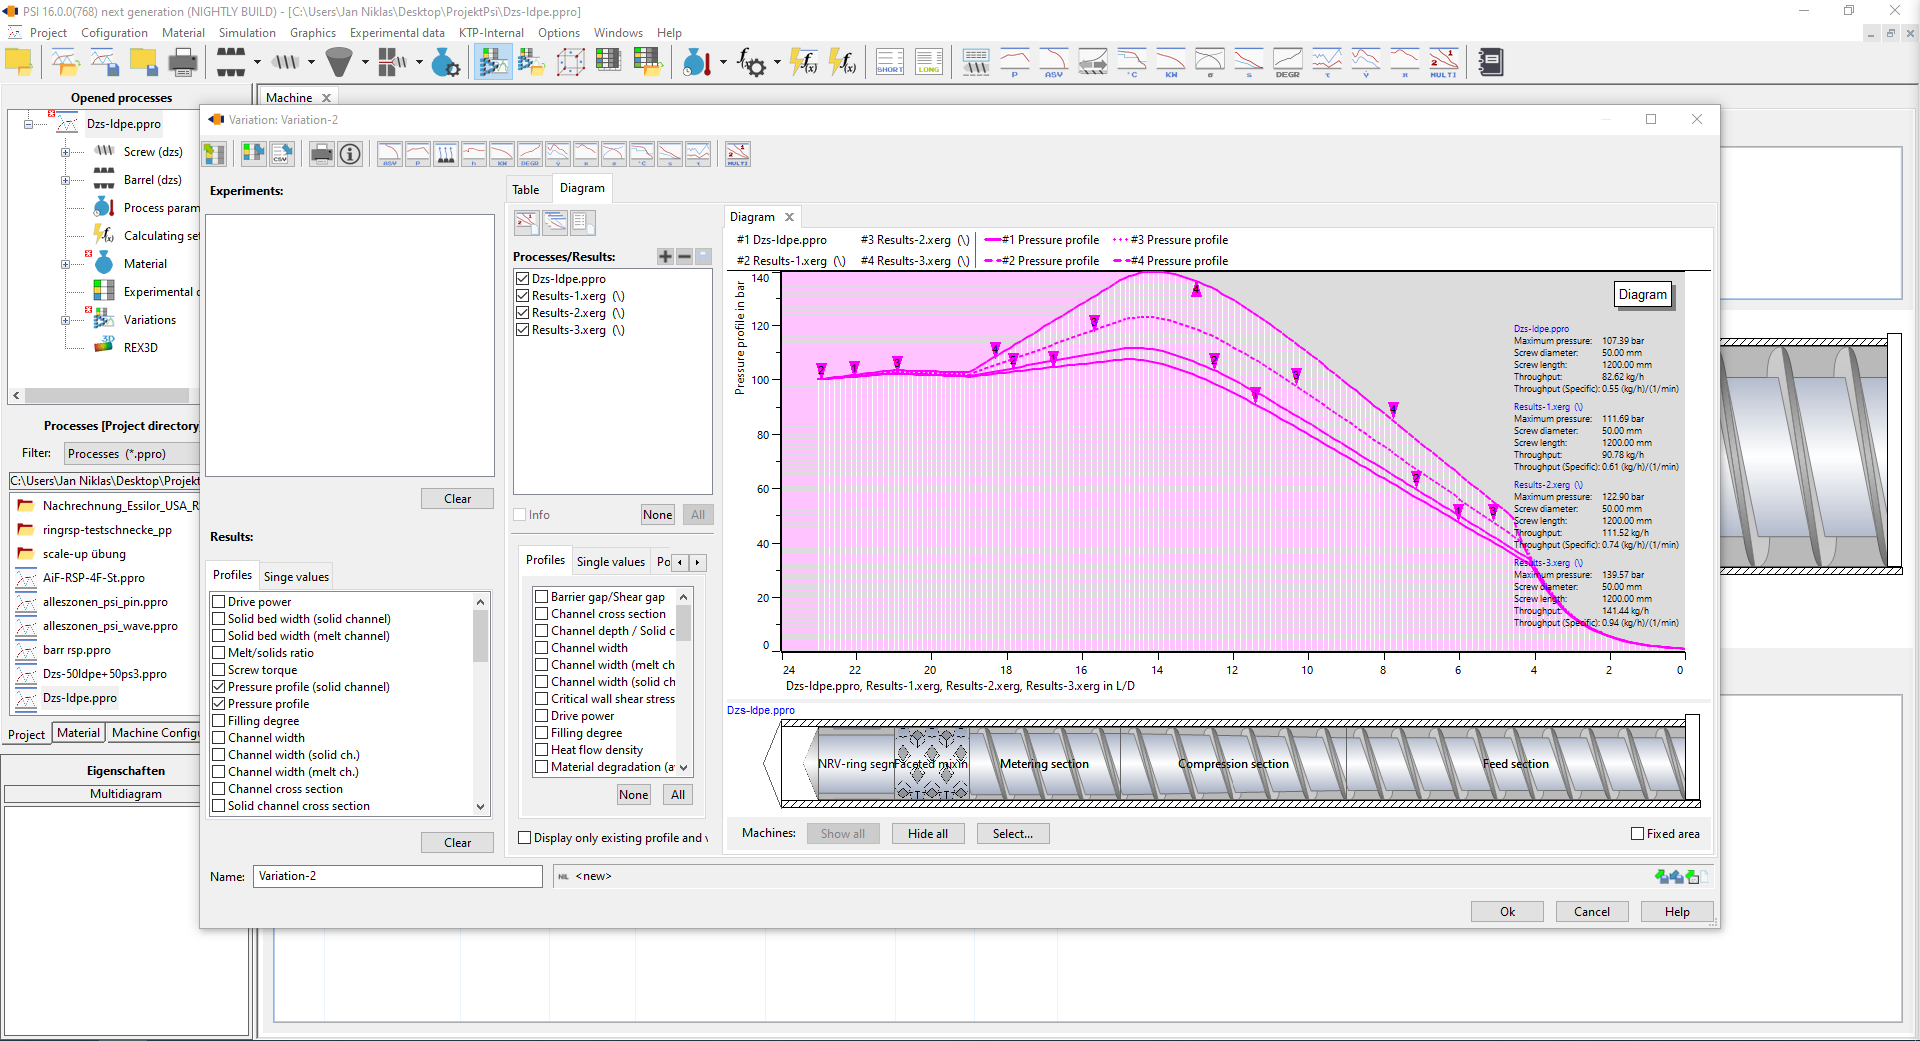
Navigate to the Display multigraphics option in the Variations manager. Select which variations and results you want to display in the graphs. The software allows you to use various profile types to present the results clearly and comprehensibly, highlighting the differences in material properties or process parameters between the individual variations. Compare the graphs of the different variations to analyze the impact of material changes on the selected target values.
Final Step: Save and export results
After displaying and analyzing the results in graphs, you can save or export this information for future reports or presentations: Click on Save Results to store the data in the software. If desired, you can export the results as an Excel file or PDF to share them with colleagues or departments, or to include them in detailed technical documentation.